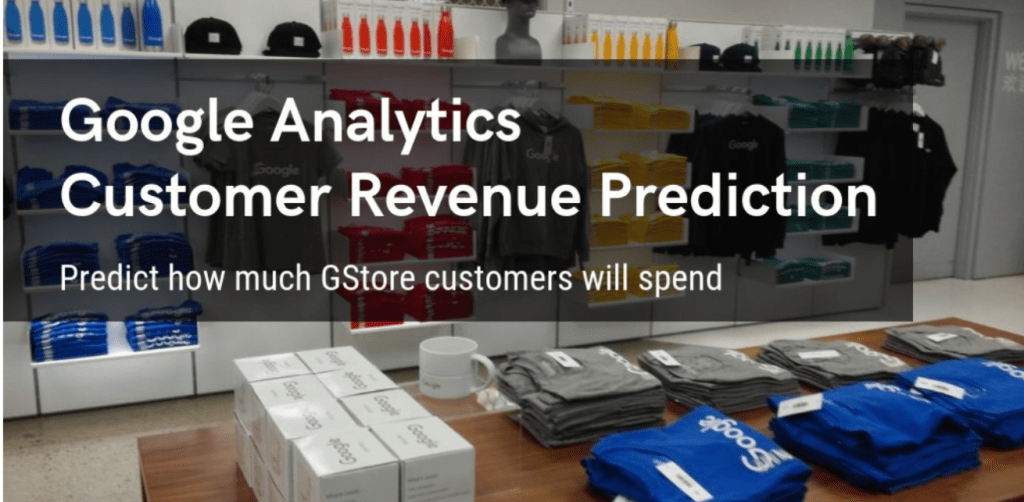
Google Analytics Customer Revenue Prediction
The 80/20 rule has proven true for many businesses–only a small percentage of customers produce most of the revenue. As such, marketing teams are challenged to make appropriate investments in promotional strategies.
Introduction
The goal of our analysis was twofold. Our first objective was to identify factors or customer behaviors that rendered customers more likely to make a purchase. Our second goal was developing accurate predictions of transaction revenue based on our findings from the first objective.
The data was collected from 2016 to 2017, train dataset (903,653 observations and 55 variables) dataset are given in JSON string and test dataset (804,684 observations and 53 variables) is used for revenue predictions.Thus, we decided to use a logistic regression model to determine the most important variables in predicting purchase probability. Then followed this model with a semi-log linear regression to predict transaction revenue.
Data Cleaning
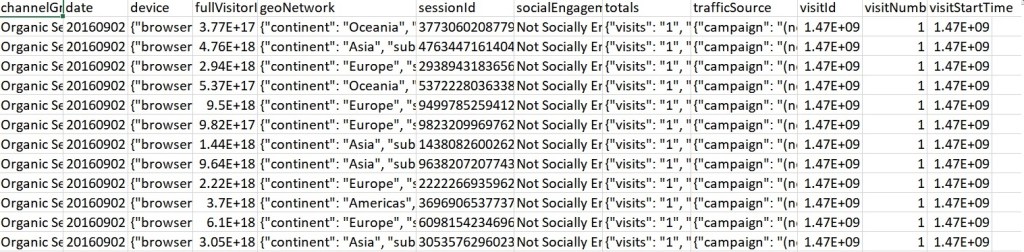
The JSON data looks messy so we split the JSON strings into different attributes.
1. Removing missing values: This was a substantial task in our cleaning process. We deleted variables if they contained over 90% missing values, including detailed features of browser, operating system, mobile devices, latitudes, longitudes, and network location, etc.
2. Deletion of duplicate session IDs: The session ID should be unique. As a result, we deleted ~1000 duplicate session IDs in our dataset.
3. Deletion of records with missing geographical information: We deleted records with missing values in all geographical information.
4. Recode into dummy: we keep top 4 or 5 levels, and combine small numbers into level ‘other’, large number of NA set into another level (city, time, etc)
5. Time conversion: We leveraged Google API to calculate longitudes and latitudes based on city-level and converted the start time of each session into its local time zone.
6. Log transformation: Since transaction revenue does not follow the normal distribution, we did a log transformation on this variable.
The train dataset contains more than half a million observations. To train and evaluate models efficiently, we randomly took 75% of the dataset as the train dataset, and input the remaining 25% into the validation dataset.
Variable Selection: We had to conduct preliminary variable selection to determine what would be included.
1. Removing Multicollinearity: Variables that were highly correlated with each other would have a negative impact on our models. Therefore, we made decisions on keeping and removing variables whose VIF exceeds 10, such as hits
2. Removing insignificant factors: During the modeling process, we removed factors whose levels don’t have statistical significance, meaning their p-values exceed a 0.05 significance level
3. Removing factors that contradict domain knowledge: In our model, some factors are significant, but their explanations of coefficients go against our domain knowledge.
Exploratory Data Analysis
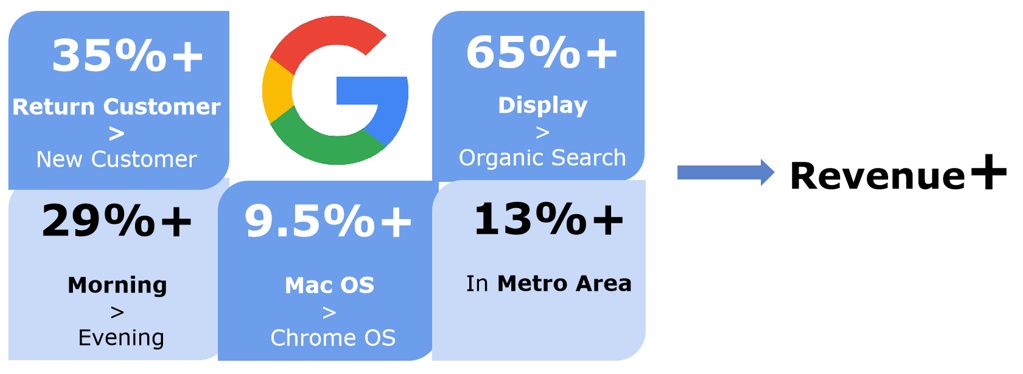
It showed that if a customer is a return customer, it is more likely he or she will generate approximately 35% more revenue compared to new customers.
In consistent with our analysis before, for channel, if a customer are accessing our website through Display channel, 65% more revenue are stimulated compared to people who are from organic search.
Morning is our peak hour here, 29% more revenue comes from people who browse in the morning in contrast to the one who browse in the evening.
One more interesting finding, Mac OS tends to attracts more customer, 9.5% more revenues brought by people who uses mac os compared to people who use chrome os. Compared with people who lives in other areas, people who are in the metro area developed 13% more revenues for us.
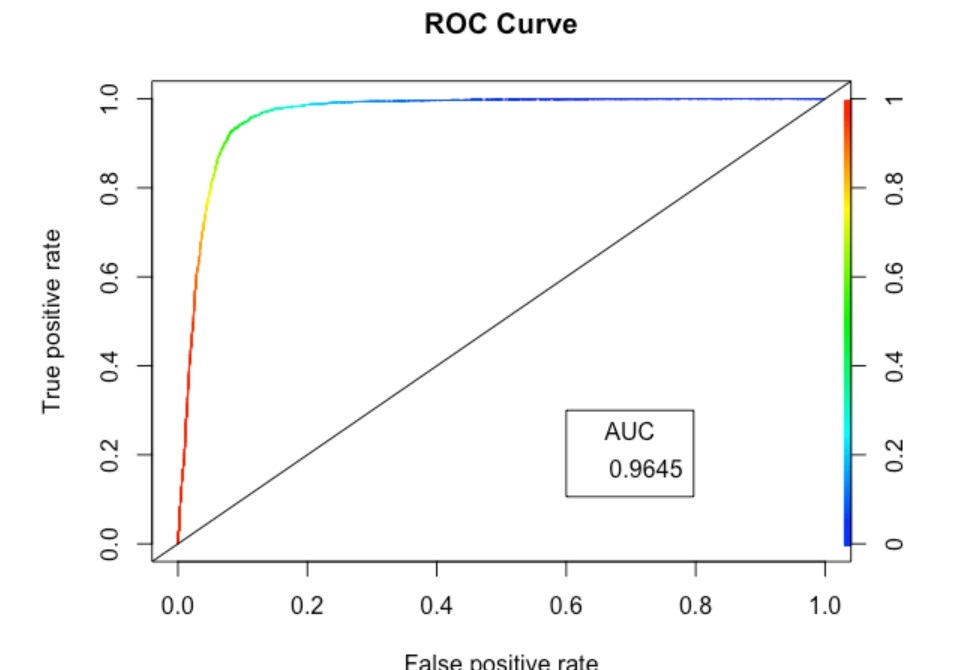
Logistic Regression for Purchase Incidence
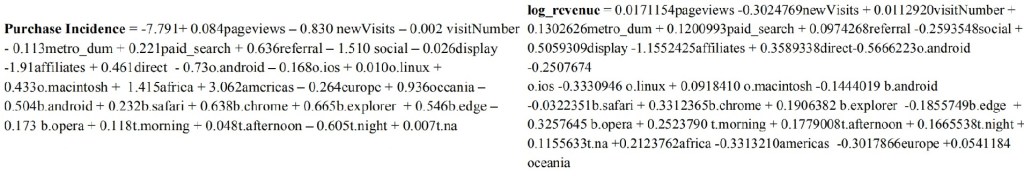
We concluded the higher the number of pages viewed per session, the higher the probability of purchase based on the positive coefficient of pageviews. Keeping other factors constant, when one more page is viewed, the odds of purchase will increase by 8.7%. By contrast, if the visitor is new to the site, his/her probability of purchase will be notably lower than a return customer, with the odds decreasing by 57.4%.
For the geographic elements, Americas and part regions have strong effects on purchase incidence. Customers living in metropolitan areas are less likely to make purchases compared to those who are not, with a 10.6% decrease in odds. Similarly, the continents are a decided element, the odds of purchase will be 2037 % higher when the location is in America.
The channel grouping indicates how visitors approach the website. Compared to organic search, visitors from paid search channels are more likely to have transactions, and the odds of making a purchase are 24.7% higher. Similarly, referral and direct are more effective channels compared to organic search, with 88.8% and 58.6% higher in odds respectively. Conversely, the visitors from affiliate and display channels have lower odds of purchase, respectively 2.5% and 85.2% lower than if visiting via organic search.
The browsers show traffic of visitors from different devices. Among the types of browsers, visitors who use Chrome have higher purchase probability. The odds of making a purchase will be 89.2% higher compared to those who use other kinds of browsers. Visitors who use Internet Explorer show a similar higher tendency, and the odds will be 94.5% higher.
Time is another influential element. Compared with the evening, at midnight people have a lower purchase incidence, and the odds of making a purchase will be 45.4% lower.
Linear Regression for Prediction